Poor access to dental care can leave people with untreated dental disease, causing pain and infection, and resulting in patients seeking care in hospital emergency departments (EDs) or non-dental urgent care settings.1 In a cross-sectional, retrospective survey, 5.4% of Canadian participants self-reported having visited an ED for a dental problem not associated with trauma (DPNAT).2 Financial constraints, geographic, cultural and personal attitudinal barriers affect access to dental care, especially for disadvantaged Canadians, who may consequently rely on EDs and urgent care facilities to manage dental pain.1
The use of EDs for DPNAT raises financial concerns in the public health system. In Ontario, Canada, the cost of ED visits and hospital admissions related to dental problems was estimated at $16.4 million a year.3 In British Columbia, the cost of such visits at 29 of 79 EDs was $1.53 million a year or about 1% of all ED costs at participating hospitals.4 In Alberta, the estimated direct cost of ED management of DPNAT (excluding hospital admission) is $4.2–6.3 million a year, with nearly 65% of diagnoses related to periapical abscesses and toothaches.1 Of further consequence, management of DPNAT in non-dental settings is often palliative to ease symptoms through antibiotic and analgesic therapy, without resolving the underlying condition.1,5 Repeat ED visits are frequent, ranging from 20% to 46% in vulnerable populations.6,7 Hence, cost estimates underestimate the actual impact of DPNAT on health care system expenditures.4
Understanding factors that are common among people using hospital EDs for DPNAT is relevant to developing policy and strategies to reduce or mitigate such use. For example, from 2011 to 2016, ED visits for DPNAT averaged 27 791 a year in Alberta.1 However, the distribution of these visits was not uniform throughout the province: on a per capita basis, the rate in the North Zone of Alberta was over 2.5 times the provincial average.1 The authors of this study called for research to identify the factors contributing to this ED use, as such information might help to optimize the effectiveness of programs and policies aimed at mitigating use of EDs for dental problems.
With this intent, our research team undertook a scoping review of literature from Canada and the United States (USA) with thematic analysis to address the research question: what factors are associated with patients’ use of EDs and urgent care facilities for non-traumatic dental problems? We chose to focus on Canada and the USA because of the similarities in dental care systems. Both countries predominately use a private fee-for-service model, and national dental public health spending is comparable in Canada and the USA.8 Here we present findings from the literature review as a first step to support further research in Alberta and other Canadian jurisdictions aimed at providing alternative options for dental care to reduce use of EDs for DPNAT.
Methods
Our scoping review used Arksey and O’Malley’s9 framework, based on 5 stages: identify the research question; identify relevant studies; select studies; chart the data; and collate, summarize and report the results.
We searched Embase, Medline-Ovid, Scopus and Web of Science databases for articles published between 2007 and 2017, using the following algorithm:
((emergenc* adj2(room* or department* or service or cent* or ward* or visit or dental or hospital*)) or *urgent care).ti. AND (indicator* or factor* or characteristic* or pattern* or associate* or correlat* or predict* or risk* or population* or provinc* or state or jurisdiction or catchment or county or counties or survey or questionnaire or territory* or epidemiological* or prevalen* or inciden*).mp. AND (dent* or tooth* or teeth or oral or carie* or odonto*).ti. NOT opioid.ti.
The search strategy was performed in consultation with a health sciences librarian with no limits on the preliminary search because of the limited number of articles catalogued and to ensure methodological rigour.
The initial search yielded 1256 articles and, after deletion of duplicate papers, 469 articles remained. Two additional articles were identified through hand searching. Inclusion and exclusion criteria, consistent with the research aim, were developed to facilitate title and abstract screening as outlined in Table 1. A tenet of the scoping review method is to map the breadth of literature for dissemination to policymakers, practitioners and consumers, without the quality appraisal typifying a systematic review.9-12 Studies from the USA and Canada were searched because of similarities in the dental health systems, cultural and demographic factors. As well, dental care systems in both countries have likeness that could affect the ED use of interest. The decision to include USA publications in the search criteria was reaffirmed when we noted similarities between Canadian and USA jurisdictions.
Two independent reviewers (JVM and HR) screened the title and abstract of each article and 55 potentially relevant articles were reviewed in their entirety. Of the 55 citations, 33 were removed following full article review because they did not fit the inclusion criteria. In cases of discrepancy, a third reviewer (RF) was enlisted. The final search and study selection process is presented in Fig. 1.
Figure 1: Search and study selection process flow chart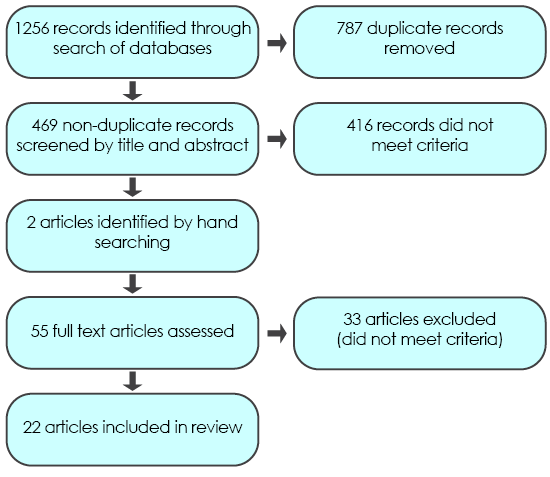
Results
For the final review, 22 primary research studies met the inclusion criteria (Table 1). These studies were charted and organized into a data extraction table (Table 2). Findings were summarized using the analytical framework of Levac et al.12 The final framework consisted of 4 macro-level influences affecting use of EDs for DPNAT: patient demographics, accessibility, economic factors and social demographic influences.[Ed. Note: Table 2 is available in the PDF version only].
| Criterion | Inclusion | Exclusion |
|---|---|---|
| Study population | Use of emergency department for dental problems not associated with trauma | Use of emergency department for dental problems other than non-traumatic dental condition(s), i.e., trauma Treatment sites other than emergency or urgent care departments Non-human studies |
| Study design | Primary study, systematic review or meta-analysis | Editorial, conference proceedings, abstract without accompanying article |
| Language | English | Non-English |
| Publication date | Publications 2007–2017 | Publications before 2007 |
Patient Demographics: Patient demographics included age, gender, race, comorbidities and oral health status indicators.
Patient Age: The studies that include age as a factor affecting ED use for DPNAT lack consistency because researchers have used different cohort boundaries, and age distribution in the study populations varies. Most research shows that young adults constitute a significant proportion of ED users for DPNAT.1,5,13-24
Data from the USA show the mean age of ED users for DPNAT is 33 years.14 Okunseri et al.18 reported that 47.7% of users were 19–33 years of age. A California-based study21 highlighted that between 2005 and 2011, ED use for DPNAT decreased for children < 18 years of age, while the percentage of adult users increased during the same period. In an adjusted model based on Medicaid claim files,20 adult use was 4 times that of children on a per capita basis. Multivariate analysis, adjusting for gender, race, income, insurance, patient location and day of visit, revealed that young working-age adults had substantially higher odds of ED use for DPNAT: for 21–35 years, adjusted odds ratio (OR) 12.45, 95% confidence interval (CI) 10.94–14.17; for 36–45 years, adjusted OR 8.00, 95% CI 7.88–10.25.15
In the Canadian context, patient survey studies have not clearly demonstrated that age is a significant influence on ED use for DPNAT.2,25 However, in a recent review of codes from the International Statistical Classification of Diseases and Related Health Problems, 10th revision, Canada (ICD-10-CA), Figueiredo et al.1 reported that 52.2% of such ED visits in Alberta were made by patients 20–44 years of age, although they did not evaluate use on a per capita basis. In Ontario, children < 5 years were the greatest users of ED for DPNAT per 100 000 among age groups of 0–5, 6–18, 19–64 and 65+ years.26 This study included data over 8 years from 2006 to 2014 that showed consistent age-related trends.26 The average use in the 0–5-year cohort was 718 per 100 000 compared with the lowest user group, 65+ years, at 394 per 100 000 ED visits.26 Trends related to age may be clarified by future research that considers per capita use with consistent age increments.
Gender: Studies considering gender as a predictor of ED visits for DPNAT are inconsistent. Based on USA data, the proportion of female users is generally greater, at 51–57%.14,16,18-20,23,24,27 Using rate ratios (RR), Okunseri et al.20 reported that males had lower rates than females (adjusted RR 0.91, 95% CI 0.83–0.99). In comparison, in 2 studies using multivariate modeling, male gender was associated with increased odds of ED use for DPNAT: adjusted OR 1.39, 95% CI 1.34–1.4415 and adjusted OR 1.29, 95% CI 1.27–1.3.24 Quiñonez2 also reported that Canadian males were more likely to have used an ED for dental concerns (OR 1.8, 95% CI 1.03–3.2); however, gender was not associated with a significant difference when all demographic variables were controlled for simultaneously. Higher use by males is consistent with findings of other Canadian-based studies.1,7,26
Race/Ethnicity: In the USA, people of Native American, African American, non-Hispanic black and Hispanic race are overrepresented in terms of ED use for DPNAT.6,15,16,20,21 Compared with whites, Native Americans and African Americans in Wisconsin had double the rate of such use: adjusted OR 2.04, 95% CI 1.50–2.76 and adjusted OR 1.71, 95% CI 1.51–1.94, respectively.20 In Iowa, Native Americans had an adjusted OR of 1.57 for ED use relative to whites (95% CI 1.34–1.84).15 The influence of ethnicity has not been studied in Canada.
Comorbidity: Based on USA data, 92–96% of patients who attend EDs with DPNAT do not present with comorbidities.13,14 In vulnerable users, such as the homeless, comorbidities appear to be much more prevalent, with over 70% of such ED users having a comorbid chronic health condition.7 The number of chronic conditions a person has significantly increases the odds of repeat ED visits for DPNAT: the rate of such ED use for patients with 3 or more chronic conditions is 3.16 times that of people without chronic health conditions.15 An association has also been reported between patients’ use of EDs for DPNAT and their overall use of EDs for other reasons, which, the authors speculate, may be indicative of a correlation between overall health and oral health.6 Tobacco use, hypertension, broken teeth, asthma, diabetes and swelling of the head and neck were specifically identified as relevant comorbidities.6 The literature suggests that the most significant comorbidity associated with use of EDs for DPNAT is related to tobacco use.6,7 Regression analysis revealed that smoking was the only statistically significant characteristic associated with increased odds of such ED use in a high-risk vulnerable population: adjusted OR 2.61, 95% CI 1.20–5.24.7
Oral Health Status: In a general sample of adult Canadians, people reporting oral pain were > 3 times more likely to visit an ED for DPNAT: adjusted OR 3.4, 95% CI 1.2–9.7.2 Similarly, in a sample of working-poor Canadians, multivariate analysis showed that the most predictive variable in ED visits for DPNAT was experiencing a bed day because of dental pain: adjusted OR 8.8, 95% CI 1.6–47.8.25 Furthermore, the prevalence of ED visits for DPNAT was slightly higher among working poor, but not statistically different from that of the general Canadian population: 6.1% versus 5.4%, p > 0.05.25
Accessibility: Accessibility factors related to ED use for DPNAT included time of day, day of the week, geographic location and access to a dental practitioner.
Week Day and Time: Studies from the USA report that 64–72% of ED visits for DPNAT occur on weekdays.13,15,18,23,24 However, Okunseri et al.18 report 20% higher rates of use on weekends and 40–50% higher rates during non-working hours, when patients are free from work and dental offices may not be open. ED use has been found to peak during usual after-work hours (1700–1800) and then drop off in late evening (2100).18,23 Use was also lowest at 0500, increasing during the morning to peak at 1000–1100, then declining in early afternoon before the subsequent evening peak.23 In adjusted models, compared with 19–33 year olds, patients < 18 years had statistically significantly higher relative rate ratios (RRRs) for ED use for DPNAT during non-working hours (RRR 1.6–1.8), whereas those aged ≥ 73 years had lower rates of use (RRR 0.4, p = 0.0005).18 Self-paying and Medicaid-insured patients had lower rates of use during non-working or evening hours compared with those with private insurance (RRR 0.6–0.7, p < 0.0003).18 In general, week-day, non-working hours were a peak use time.
Geographic Location: Trends related to urbanicity and ED use for DPNAT are inconsistent. Although Fingar et al.5 reported that and urban dwellers constitute over 90% of such users, regardless of insurance type in the USA, in other studies using multivariate analyses, the effect of urbanicity has differed between jurisdictions. Based on USA data from 2012, Darling et al.15 reported that people living in large and small metropolitan and micropolitan areas all had statistically significantly greater odds of ED use for DPNAT compared with rural patients with adjusted ORs (95% CI) of 1.47 (1.26–1.73), 1.22 (1.16–1.28) and 1.43 (1.36–1.50), respectively; whereas Walker et al.24 found that rural patients were more likely to use EDs for DPNAT than urban residents (adjusted OR 1.16, 95% CI 1.14–1.18) based on 2008 data. Urban dwellers were more likely to have multiple visits.15
The reason for the variation is unclear; however, Okunseri et al.27 found that urbanicity may be a less consequential determinant of ED use for DPNAT than travel distance. In their study, although Medicaid enrollees living in metropolitan and micropolitan areas had higher ED use compared with their rural counterparts, urbanicity was not a statistically significant predicator after adjusting for travel distance to an ED. Enrollees residing > 4.8 km from the nearest ED had significantly lower user rates.27 The effect of travel distance for non-Medicaid enrollees was not evaluated.
Canadian research evaluating the effect of geographic location on ED use is limited. People residing in rural Ontario had nearly twice the number of ED visits for DPNAT (about 600 people per 100 000 annually) compared with urban dwellers.26 Similarly, ED visits per 100 000 people in South (4662), Central (5584) and North (9944) zones of Alberta were higher than in Calgary (2438) and Edmonton (1979), the largest urban centres in Alberta.1 Correlative effects of geographic location and ED use for DPNAT in a Canadian context could be further clarified through regression analysis.
Access to Dental Practitioner: Limited access to care by a dentist led parents to use EDs for their children’s dental needs in Quebec, Canada.28 Subthemes from this qualitative analysis included dentist referring to EDs for DPNAT, dentist unavailability and patient perceptions of inadequate care in the dental office.28
Quantitative evaluations of dentist-to-population ratios vary across patient populations. A state-wide retrospective analysis established that a 1% increase in the supply of dentists was associated with a 0.17% decrease in ED use for DPNAT.6 Similarly, in a cross-sectional analysis of Medicaid enrollees in Wisconsin, areas with partial and entire shortages of dental professionals had higher rates of ED use for DPNAT: adjusted OR 1.18, 95% CI 1.04–1.32 and adjusted OR 1.20, 95% CI 1.04–1.39, respectively20; however, in a second study by the same principal investigator, this effect was not statistically significant after adjusting for travel distance.27 Based on data on Medicaid enrollees in 29 USA states, after adjusting for all other demographic variables and stratifying by location, higher dental provider density was associated with lower rates of ED use for DPNAT in rural counties (RR 0.89, 95% CI 0.82–0.97), but not in urban counties (RR 0.98, 95% CI 0.94–1.03).5 The authors of this study posited that this effect may be due to constraints related to dentists accepting Medicaid patients.5
Economic Influences: Economic variables included insurance status, inability to pay and income at both individual and community levels.
Insurance: In all USA studies, uninsured people and Medicaid enrollees together made up 60–82% of all ED users for DPNAT.6,13,14,16-18,21-23,29 Consistent with other studies,15,22,24 Okunseri et al.19 observed that Medicaid enrollees and self-payers were 2–3 times more likely to use EDs for this purpose than those with private insurance compared with other visit types. Across USA studies, private insurance users had lower odds of ED use for DPNAT, and Oh and Leonard17 concluded: “accessibility and expanded scope of coverage offered by private dental insurance allows covered adults to more easily seek routine and necessary dental care in more cost-effective settings with ensured quality of care, which eventually contributes to a savings of public and private funds” (p. 369).
Similarly, in a pediatric study that examined all ED visits, as the percentage of patients covered through Medicaid increased, the likelihood of pediatric use of EDs for DPNAT also increased.29 Fingar et al.5 indicated that variations in the extent of dental Medicaid coverage had less influence. In this study, Medicaid covered adults for non-emergency dental care in some counties, but not in others. After accounting for all other variables, the variation in Medicaid coverage had no significant effect on rate of ED use for DPNAT (RR 1.00, 95% CI 0.99–1.02).5
Two Canadian studies assessed the effect of insurance coverage on such ED use. In a stratified sample of Canadian adults, uninsured patients had greater odds of use compared with those with insurance (OR 2.7, 95% CI 1.5–4.7); however, dental insurance was not predictive in an adjusted model, and only income and oral pain were statistically significant.2 In a parallel study of working poor Canadians,25 those with public dental coverage were more likely to use EDs for DPNAT compared with those with private insurance (OR 3.6, 95% CI 1.4–9.4); however, insurance status was not statistically significant once all variables were accounted for simultaneously.
Inability to Afford Dental Care: Studying ED use for DPNAT by working poor Canadians, Ramraj and Quiñonez25 reported that having a history of being unable to pay for dental care was statistically significant (adjusted OR 4.4, 95% CI 1.4–14.0). Furthermore, other than reporting a bed day because of dental pain, an inability to pay was the only other variable that was significant.25 The authors suggest that extended public coverage and more robust options for care through public dental clinics could provide alternatives to the working poor. In another Canadian study using qualitative inquiry,28 parents’ socioeconomic challenges related to working extended or irregular hours resulted in families using EDs for DPNAT for their children, even though their provincial government provided free dental care to all children under age 10.
Income: In Canada, after oral pain, income was the most predictive characteristic of ED use.2 Of particular significance, people with an annual income $40 000–60 000 were 3 times more likely to use EDs for DPNAT compared with those with income ≥ $80 000 (adjusted OR 3.0, 95% CI 1.04–8.9). Incomes < $40 000 and $60 000–80 000 were not associated with increased ED use.2 In addition, Ramraj and Quiñonez25 reported that the prevalence of ED use for DPNAT among the working poor (before tax income < $34 300/year) was not significantly different than that of the general Canadian population (p > 0.05). Using neighbourhood income quintiles in Ontario, Singhal et al.26 determined that the average number of ED visits for DPNAT from 2006 through 2014 was 2.3 times higher for people living in the lowest-income neighbourhoods compared with those in the highest-income neighbourhoods.
Several USA studies have also considered the predictive value of median income by ZIP code. In general, people with lower incomes or those residing in areas with lower median family incomes are more likely to use EDs for DPNAT than their higher-income counterparts.13-15,22,24 Using national USA data, Allareddy et al.14 found that absolute numbers of ED visits for DPNAT were greatest for those residing in ZIP codes associated with the lowest annual incomes and that for each successive increasing income increment, use was lower.
Social Demographic Influences: On a broader community–social demographic level, the effect of residing in a higher immigrant, non-English speaking catchment area and the influence of homelessness on ED use for DPNAT has been evaluated. Research has also considered the influence of repeat visits.
Community Demographics: Data from Ontario showed that people residing in neighbourhoods with the highest immigrant concentration by tercile visited EDs for DPNAT approximately 9 times more often than those living in neighbourhoods with the lowest tercile immigrant concentration.26 However, when Figueiredo et al.7 examined ED use for DPNAT among homeless people in a large Canadian city, they found that those born in Canada visited the ED more than immigrants (OR 0.39, 95% CI 0.22–0.68), but this was not a statistically significant predictor after all demographic variables were accounted for simultaneously. In interpreting this finding, it is important to note that Figueiredo et al.7 focused on use by homeless people, who may have unique influences not generalizable to the entire population.
In the USA, research found that after controlling for first-level demographic variables, ED use for DPNAT was higher among people who lived in areas where a higher proportion of the population spoke a language other than English.16 The authors suggested that the influence of language spoken at home may be related to cultural factors regarding underuse of preventive care services.
Homelessness: The study conducted by Figueiredo et al.7 emphasized that homeless people are high users of EDs for both non-dental and dental problems, with 8.0 times as many ED visits and 18.2 times as many ED visits for DPNAT compared with a control group of low-income people matched by age and gender. Men over 25 years of age, born in Canada, who had been homeless for more than 2 years, had chronic health conditions and who smoked were more frequent users of EDs for DPNAT. Furthermore, 46% of the homeless people in this study visited the ED for DPNAT more than once during the 2005–2009 observation period, which suggests that this cohort may have difficulty accessing dental care in the community.
Repeat Visits: Users of EDs for DPNAT receive palliative dental care there and, subsequently, do not seek definitive care at a dental office, resulting in multiple ED visits.6,15,22 Although people with more than 4 such visits represent only 4.2% of all users, they account for 21.3% of all ED visits for DPNAT.6 Among repeat users, 44% use more than 1 ED facility. Such use is considerable among those who are frequent ED users (≥ 4 visits): 75% use 2 or more sites and 40% use 3 or more.6
Discussion
Visiting EDs for DPNAT is neither an appropriate nor effective use of health care resources, and management in this setting often does not provide definitive dental treatment.1 Despite inconsistencies in the methods of the reviewed studies, 4 macro-level factors — patient demographics, access to providers, economic factors and social demographic influences — permeate the literature on ED use for DPNAT and must be considered when planning and implementing strategies to reduce such visits.
Canadian studies have shown that an inability to attend regular dental care and to afford dental care lead people to visit EDs for DPNAT.2,25 Some research from Canada suggests that income is also a factor,2,26 and studies from the USA show that income is a strongly contributing factor.13-16,22,23 Hong et al.16 established that focusing analysis on community-level determinants, such as ZIP-code median income and the proportion of the population with a language other than English spoken at home, can be used to assess risk of ED use for DPNAT at a population health level. This finding is of particular importance in that efforts focused on changing care-seeking behaviour may be less effective than focusing on population-level determinants16 and is consistent with Canadian data showing that living in a low-income, high-immigrant concentration neighbourhood is associated with greater use of EDs.26
In USA studies, Medicaid enrollees and uninsured people had significantly greater odds of using EDs for DPNAT,6,15,16,19,21,22,29 whereas insurance status was not statistically significant in the Canadian population.2,25 The reason for this difference may be a result of variations in health policy or simply differences in research methods across the reviewed studies. Future Canadian-based studies analyzing demographic data and ICD-10-CA codes could clarify this difference.
Singhal et al.26 reinforced the desirability of assessing trends in ED use for DPNAT in Canadian provinces other than Ontario to help gauge the national burden of such visits. They recommended that future research use consistent methods so that interprovincial comparison is feasible. In addition to methodological consistency, factors and variables examined in future research must also be consistent. This scoping review, which provides a thematic analysis of factors associated with ED use can contribute to the evolution of consistent study format and content in future research. In addition, community-engaged research with high users of EDs is an important future direction to determine programming and policy solutions to address use of EDs for DPNAT.
This review had some limitations. Although the search strategy used common medical databases, grey literature was not included. Furthermore, only primary studies and reviews were included, which limited the number and type of studies in the review. Evaluating methodological rigor of individual studies is also outside of the purpose of a scoping review. In a Canadian context, once the body of evidence is more substantive, a systematic review and meta-analysis could help quantify factors that are commonly associated with ED use for DPNAT; however, at this time, the literature is insufficient to provide robust quantification.
Conclusion
The aim of this review was to carry out a preliminary mapping of factors associated with patients’ use of ED visits for DPNAT. We identified individual demographics, accessibility, economic and social influences as macro-level factors affecting such use. Although additional research is needed, income and inability to afford care appear to be common factors. Identification of these factors can help guide future research focused on specific needs and characteristics of the local socioeconomic environment. This review could guide planning for the provision of dental care services and inform health policies to address ED use for DPNAT.
THE AUTHORS
 |
Ms. VanMalsen is a registered dental hygienist, Alberta Health Services, Red Deer, Alberta. |
 |
Dr. Figueiredo is provincial dental public health officer, Alberta Health Services, Edmonton, Alberta. |
 |
Dr. Rabie is division chief, Community/Public Health Dentistry, Alberta Health Services, Calgary, Alberta. |
 |
Dr. Compton is professor and director, Dental Hygiene Program, Edmonton Clinic Health Academy, University of Alberta, Edmonton, Alberta. |
Correspondence to: Jacqueline R. VanMalsen, University of Alberta, 5th Floor Edmonton Clinic Health Academy, 11405—87 Avenue, Edmonton AB T6G 1C9. E-mail: jvanmals@ualberta.ca
The authors have no declared financial interests.
This article has been peer reviewed.
References
- Figueiredo R, Fournier K, Levin L. Emergency department visits for dental problems not associated with trauma in Alberta, Canada. Int Dent J. 2017;67(6):378-83. doi.org/10.1111/idj.12315.
- Quiñonez C. Self-reported emergency room visits for dental problems. Int J Dent Hyg. 2011;9(1):17-20.
- Quiñonez C, Ieraci I, Guttmann A. Potentially preventable hospital use for dental conditions: implications for expanding dental coverage for low income populations. J Health Care Poor Underserved. 2011;22(3):1048-58.
- Brondani M, Ahmad SH. The 1% of emergency room visits for non-traumatic dental conditions in British Columbia: misconceptions about the numbers. Can J Public Health. 2017;108(3):e279-81. doi:10.17269/cjph.108.5915.
- Fingar KR, Smith MW, Davies S, McDonald KM, Stocks C, Raven MC. Medicaid dental coverage alone may not lower rates of dental emergency department visits. Health Aff (Millwood). 2015;34(8):1349-57.
- DeLia D, Lloyd K, Feldman CA, Cantor JC. Patterns of emergency department use for dental and oral health care: implications for dental and medical care coordination. J Public Health Dent. 2016;76(1):1-8.
- Figueiredo R, Dempster L, Quiñonez C, Hwang SW. Emergency department use for dental problems among homeless individuals: a population-based cohort study. J Health Care Poor Underserved. 2016;27(2):860-8.
- Canadian Academy of Health Sciences. 2014. Improving access to oral health care for vulnerable people living in Canada. Ottawa: Canadian Academy of Health Sciences; 2014. Accessed 2018 Aug 14. Available from: http://cahs-acss.ca/wp-content/uploads/2015/07/Access_to_Oral_Care_FINAL_REPORT_EN.pdf.
- Arksey H, O’Malley L. Scoping studies: towards a methodological framework. Int J Social Res Methodol. 2005;8(1):19-32.
- Armstrong R, Hall BJ, Doyle J, Waters E. Cochrane update. ‘Scoping the scope’ of a Cochrane review. J Public Health (Oxf). 2011;33(1):147-50.
- Daudt HM, van Mossel C, Scott SJ. Enhancing the scoping methodology: a large, inter-professional team’s experience with Arksey and O’Malley’s framework. BMC Med Res Methodol. 2013;13(1):48.
- Levac D, Colquhoun H, O’Brien KK. Scoping studies: advancing the methodology. Implement Sci. 2010;5(1):69.
- Allareddy V, Nalliah RP, Haque M, Johnson H, Rampa SB, Lee MK. Hospital-based emergency department visits with dental conditions among children in the United States: nationwide epidemiological data. Pediatr Dent. 2014;36(5):393-9.
- Allareddy V, Rampa S, Lee MK, Allareddy V, Nalliah RP. Hospital-based emergency department visits involving dental conditions: profile and predictors of poor outcomes and resource utilization. J Am Dent Assoc. 2014;145(4):331-7.
- Darling BG, Singhal A, Kanellis MJ. Emergency department visits and revisits for nontraumatic dental conditions in Iowa. J Public Health Dent. 2015;76(2):122-8.
- Hong L, Liu Y, Hottel TL, Hoff GL, Cai J. Neighborhood socio-economic context and emergency department visits for dental care in a US midwestern metropolis. Public Health. 2015;129(3):252-7.
- Oh J, Leonard L. Hospital emergency department visits for non-traumatic oral health conditions among Rhode Island adults age 21-64 years, 2006-2010. Med Health R I. 2012;95(11):367-9.
- Okunseri C, Okunseri E, Fischer MC, Sadeghi SN, Xiang Q, Szabo A. Nontraumatic dental condition-related visits to emergency departments on weekdays, weekends and night hours: findings from the National Hospital Ambulatory Medical Care survey. Clin Cosmet Investig Dent. 2013;5:69-76.
- Okunseri C, Okunseri E, Thorpe JM, Xiang Q, Szabo A. Patient characteristics and trends in nontraumatic dental condition visits to emergency departments in the United States. Clin Cosmet Investig Dent. 2012;4:1-7.
- Okunseri C, Pajewski NM, Brousseau DC, Tomany-Korman S, Snyder A, Flores G. Racial and ethnic disparities in nontraumatic dental-condition visits to emergency departments and physician offices: a study of the Wisconsin Medicaid program. J Am Dent Assoc. 2008;139(12):1657-66.
- Rampa S, Wilson FA, Allareddy V. Trends in dental-related emergency department visits in the State of California from 2005 to 2011. Oral Surg Oral Med Oral Path Oral Radiol. 2016;122(4):426-33.
- Sun BC, Chi DL, Schwarz E, Milgrom P, Yagapen A, Malveau S, et al. Emergency department visits for nontraumatic dental problems: a mixed-methods study. Am J Public Health. 2015;105(5):947-55.
- Tomar SL, Carden DL, Dodd VJ, Catalanotto FA, Herndon JB. Trends in dental-related use of hospital emergency departments in Florida. J Public Health Dent. 2016;76(3):249-57.
- Walker A, Probst JC, Martin AB, Bellinger JD, Merchant A. Analysis of hospital-based emergency department visits for dental caries in the United States in 2008. J Public Health Dent. 2014;74(3):188-94.
- Ramraj CC, Quiñonez CR. Emergency room visits for dental problems among working poor Canadians. J Public Health Dent. 2013;73(3):210-6.
- Singhal S, McLaren L, Quiñonez C. Trends in emergency department visits for non-traumatic dental conditions in Ontario from 2006 to 2014. Can J Public Health. 2017;108(3):e246-50.
- Okunseri C, Vanevenhoven R, Chelius T, Beyer KM, Okunseri E, Lobb WK, et al. Travel distances by Wisconsin Medicaid enrollees who visit emergency departments for dental care. J Public Health Dent. 2016;76(3):213-9.
- Mostajer Haqiqi A, Bedos C, Macdonald ME. The emergency department as a ‘last resort’: why parents seek care for their child’s nontraumatic dental problems in the emergency room. Community Dent Oral Epidemiol. 2016;44(5):493-503.
- Hom JM, Burgette LF, Lee JY. The effect of North Carolina hospital payor mix on dental-related pediatric emergency room utilization. J Public Health Dent. 2013;73(4):289-96.