
Abstract
Objectives: The availability of dentists as a barrier to access to care has not been thoroughly explored, particularly in large cities. In this study, we aimed to identify disparities in the availability of dentists in Canada’s largest urban centre, Toronto, and explore whether distributional disparities are associated with underlying factors, such as affordability as measured by average household income.
Methods: Geocoded data on number of dentists and population estimates for metropolitan Toronto’s forward sortation areas (FSA) were used to calculate dentists per 100,000 population. Dentist density and average annual household income by FSA were then mapped using geographic information system techniques. Pearson testing was used to identify associations of various factors with dentist density. Significance testing was performed to compare average dentist to population ratios in high (> $100,000) and low ($40,000–$60,000) income FSAs.
Results: Communities with high household incomes and high dentist density were clustered in central Toronto. Income-based disparities in dentist distribution were also observed. Compared with low-income FSAs, dentist density increased by a factor of 2.47 in the highest income FSAs. Dentist density also increased with income and education but decreased with immigrant level.
Conclusions: Dentist availability may be linked to demographic factors, including affordability. The income-based disparity in availability in Toronto was as high as that observed elsewhere between rural and urban communities.
A patient’s ability and decision to access dental care are influenced by such factors as income, insurance and education.1-3 These important predictors are part of 3 overarching barriers to accessing care: affordability, acceptability and availability.4,5 Affordability and acceptability relate to financial (e.g., access to dental insurance) and cultural (e.g., a patient’s willingness to receive dental care) factors. Availability depends on the number of local service points (such as clinics or dentists) that a patient can choose from.4 Thus, availability represents the relation between geographic distribution of services and access to care.
Studies on the availability of dental care show a common contrast between urban and rural populations in terms of the distribution of dentists.6,7 Using geographic information systems (GIS) to pinpoint the location and number of dentists, researchers have also shown that a large majority of dentists practise in metropolitan as opposed to rural areas.8-10 Additional analyses have often revealed associations between the distribution of dentists and various socioeconomic characteristics, such as the income of people within a community.10-12
In the Canadian context, the role of availability as an access-to-care barrier has not been thoroughly explored, particularly in large metropolitan centres. Thus, the focus of this study was to use GIS-based techniques to map dentist distribution in metropolitan Toronto and identify any disparities in distribution across communities. The potential relation between geographic distribution of dentists and affordability was also explored. Regional availability, or distribution, of dentists was measured in terms of dentists per 100,000 population. We hypothesized that, although both availability of dentists and affordability can individually act as barriers to dental care, there is also an association between these 2 dimensions such that regions in which affordability is less of a barrier are also likely to enjoy higher availability of dentists. Ultimately, we hope to add the rarely explored geographic dimension of access to current policy debates and improve understanding of interactions between the geographic availability of dental care and financial and other barriers to care.
Methods
Sample Population
Community boundaries in metropolitan Toronto were defined based on forward sortation areas (FSAs). An FSA represents a geographic region in which all postal codes start with the same 3 characters. Of the 102 Toronto FSAs, complete data for 96 were available and used. These represent a sizable population (26,075 people on average) that could readily be served by more than 1 dentist. The 6 excluded FSAs have populations of fewer than 15 people, and census data for them are not provided by Statistics Canada.13 Demographic data by FSA were obtained from the last available complete census as of March 2012, i.e., the 2006 census.14 A geospatial boundary data file defining FSA boundaries (such as latitudes and longitudes) was also used for mapping.15
Geocoded data on number of dentists in each Toronto FSA in 2012, determined through their practice addresses, were obtained from the Ontario Dental Association. Dentists with multiple practice locations were included in all FSAs in which they were practising. Therefore, our total dentist estimate (2,730, including both general practitioners and specialists) was greater than the actual number of dentists practising in Toronto (2,560). Because FSA populations varied, the number of dentists per 100,000 population was computed for each FSA. These standardized ratios were then used for mapping and data analysis.
Data Mapping
Using a web-based GIS application (Fusion Tables, Google Inc., Mountain View, Cal.), both FSA boundaries and dentists per 100,000 population were plotted on an intensity map. This was prepared by classifying FSAs into 5 groups based on dentists per 100,000 population: very low (0 to 40), low (> 40–80), middle (> 80–120), high (> 120–160) and very high (> 160). The middle range (> 80–120) was chosen based on the median dentist density of 83.3 dentists per 100,000 population.
To determine income-related disparity in distribution of dentists across Toronto, a similar intensity map for average household income by FSA was generated. Here, each FSA was classified into 1 of 4 groups based on average annual household income: low ($40,000–$60,000), middle (> $60,000–$80,000), upper middle (> $80,000–$100,000) and high (> $100,000–$400,000). These groups were chosen as average income for all FSAs was between $48,642 and $367,065. The average number of dentists per 100,000 population for each income group was also computed and the relation between income and dentist distribution graphed.
Statistical Analysis
To determine whether differences in the dentist-to-population ratio across income groups were significant, negative binomial regression was carried out. This technique is used specifically for modeling count data such as ours (i.e., dentists per FSA), with number of dentists as the dependent variable and FSA population as the offset variable. Thus, the number of dentists was controlled for FSA population size, such that the model output could be interpreted as the ratio of dentists to population across FSAs.
An income group value (ranging from 0 to 3, with 0 the lowest and 3 the highest income range) was assigned to each FSA based on its average household income, and this served as the independent variable. Using the lowest-income group as a reference, the model tested whether differences in the average dentist-to-population ratio between the reference group and the remaining 3 income groups were significant. This model has been used before in studies on distributional inequities.10 It is preferred over a simple linear regression model as the count data modeled do not follow a normal distribution. Furthermore, it has been used in place of Poisson distribution to account for over-dispersion (unequal mean and variance) in the dependent variable.
For further analysis of population characteristics, Pearson correlation estimates of the relation between dentists per 100,000 population and various demographic variables were computed. All data analysis was conducted using the statistical software, Stata version 9.0 (StataCorp, College Station, Tex.).
Results
The map of average annual household income (Fig. 1) reveals 2 distinct clusters. Of the 21 communities with incomes above $100,000, most (81%) are located in central Toronto. This high-income cluster is surrounded by middle- and upper-middle-income areas that form the majority (57%) of the 96 Toronto FSAs. To the west of the high-income cluster is a distinct low-income cluster (> $40,000–$60,000) which includes 50% of the 20 low-income FSAs in Toronto.
NOTE: Click to enlarge figures.
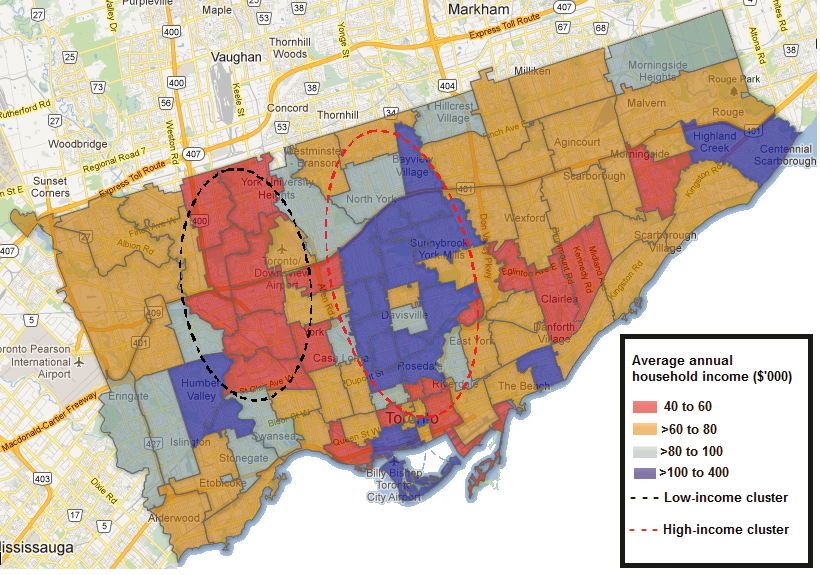 Figure 1: Distribution of average annual household income ($’000) by forward sortation area in metropolitan Toronto. Areas with high average income are clustered (red dotted line) as are those with low average income (black dotted line).
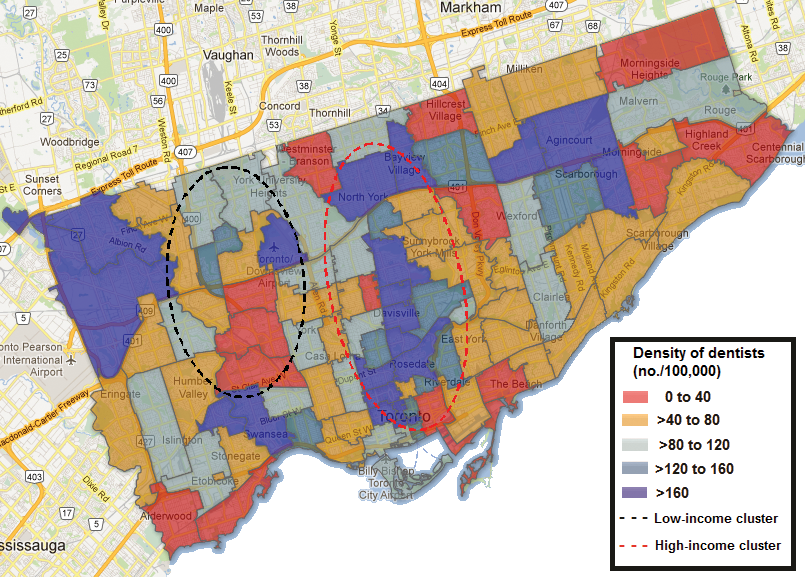 Figure 2: Distribution of dentists (no. per 100,000 population) across forward sortation areas in metropolitan Toronto. The locations of the high and low average annual household income clusters identified in Fig. 1 are shown for reference.
Some geographic clustering of dentists is also observable (Fig. 2). In about 33% of the FSAs (32/96), the number of dentists per 100,000 population is high or very high (≥ 120). Most of them (75% or 24/32 FSAs) are situated in central Toronto within the same area as the high-income cluster shown in Figure 1. In contrast, half of the communities in the low-income cluster have low or very low dentist density with the remaining belonging to the middle ratio category.
Figures 1 and 2 indicate a possible income-dependent distribution of dentists. To further explore this relationship, we plotted dentist density versus proportion of FSAs with that density for each income group (Fig. 3). The proportion of communities with high or very high dentist density increased from 15% in the lowest income group to 47.6% in the highest. This represents a 32.6% increase in the number of communities with high dentist-to-population ratios as income increases. A second, less distinct, trend was an increase of 15.5% (from 9.5% to 25%) in the proportion of communities with very low dentist density as income decreases from the highest to lowest income group.
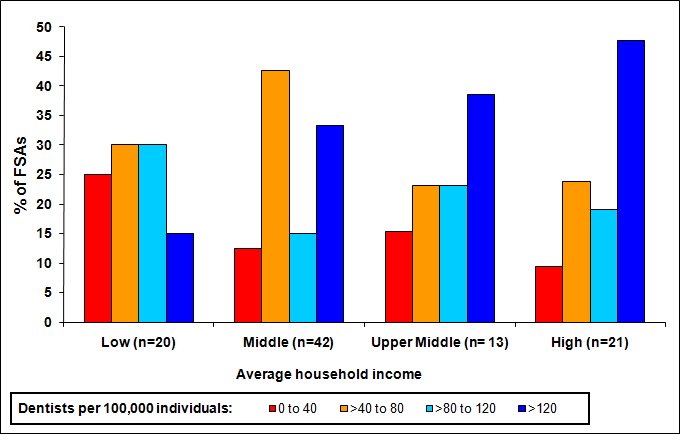 Figure 3: Percentage of FSAs with various dentist densities for each average annual household income group: low ($40,000–$60,000), middle (> $60,000–$80,000), upper middle (> $80,000–$100,000) and high (> $100,000–$400,000).
 Figure 4: Relation between density of dentists and household income in our study population.
Graphing average number of dentists per 100,000 population for each income group shows an increase from 77.9 for the lowest income group to 192.3 for the highest (Fig. 4) — a 2.47-fold increase. In other words, a dentist is 2.47 times more likely to be practising in a high-income area than a low-income one (p < 0.05). Furthermore, as the difference in income between the lowest-income reference region and comparison regions decreases, so does the likelihood of a dentist practising in the higher income region (Table 1).
Table 1: Negative binomial model results, using incidence rate ratios, show expected differences in dentist supply in middle, upper middle and high average annual income groups compared with the low average annual income group.*
| Income group | IRR† | Z scores | 95% confidence interval |
|---|---|---|---|
| 1 (> $60,000–$80,000) | 1.23 | 1.02 (p = 0.31) | 0.84–1.81 |
| 2 (> $80,000–$100,000) | 1.71 (p < 0.05) | 2.22 (p = 0.03) | 1.04–2.81 |
| 3 (> $100,000) | 2.47 (p < 0.05) | 3.91 (p < 0.01) | 1.60–3.82 |
* The dependent variable is the number of dentists per FSA; the offset variable is the population per FSA.
† IRR = incidence rate ratio (compared with $40,000–$60,000 average annual income group).
Using Pearson correlation analysis (Table 2), we explored potential associations between income, education and immigrant status of each community and its supply of dentists. Dentist supply was positively correlated with average annual household income (p < 0.01) and the percentage of residents with a high school or university education (p < 0.01). A negative correlation between dentist supply and both percentage of households with income below $20,000 and percentage of immigrants was observed (p < 0.05). There was no significant association between population density and dentist supply.
Table 2: Correlation between community characteristics and dentist supply (dentists per 100,000 population).
| Community characteristic | Pearson correlation coefficient |
|---|---|
| Average annual household income | 0.36 (p < 0.01) |
| % households with average annual household income < $20,000 | -0.25 (p = 0.02) |
| % immigrants | -0.24 (p = 0.02) |
| % people with a university education | 0.49 (p < 0.01) |
| % people with high school education | 0.43 (p < 0.01) |
| Population density | 0.91 (p = 0.38) |
Discussion
The results indicate an uneven distribution of dentists across metropolitan Toronto based on average annual household income, education and immigrant status. Moving from the lowest- to highest-income cluster, an observable increase in the number of regions with high dentist-to-population ratios (i.e., FSAs with ≥ 120 dentists per 100,000 or less than approximately 833 individuals per dentist) is seen. This disparity is reinforced by our finding that there are 2.47 times as many dentists per 100,000 population in the highest income areas than the lowest. This confirms our hypothesis that areas with higher affordability are associated with a higher availability of dentists.
It is important to view this income-based disparity in the context of factors that may further exacerbate or offset the effect of low dentist availability on demand for dental care in low-income regions. On one hand, low-income regions suffer from higher disease levels than high-income regions, with untreated caries rates for adolescents at 28.9% vs. 7.3%, respectively.16 With this higher disease burden and, hence, higher normative need in low-income regions, one would expect the disparity in dentist availability to be greater than the 2.47 IRR we found. On the other hand, the effective demand for dental care (which translates into need for dentist time) is lower in low-income regions, with only 60% of the low-income population visiting a dentist in the past year in contrast to 83.8% of the high-income population.16 This lowers the effective demand by low-income groups, which to some extent mitigates the low availability of dentists in low-income regions. Nevertheless, making dental visits is also heavily influenced by income and an associated lack of dental insurance.16
This study has a number of strengths, but some limitations. It is the first study of a Canadian population that looks at geographic distribution of dentists, via GIS-based techniques, in relation to underlying community characteristics. Our finding of lower levels of dentist availability outside central regions could be an important barrier to accessing dental care, especially in cities already suffering from a low supply of dentists. Furthermore, the income-based disparity in our study population (2.47 times as many dentists per 100,000 population, on average, in the highest- vs. lowest-income group) is greater than that observed in the literature between urban and rural populations. Most studies at a state or region level in the United States show that urban populations have 1–2 times as many dentists per 100,000 as rural populations.8,17-19
The income effect on distribution could, therefore, be important in identifying areas for implementation of programs and policies to relieve access to care problems, i.e., focusing not only on rural but also on other low-income communities. A higher density of dentists has also been shown to mitigate the disparity in use of dental care between high- and low-income groups.20 Therefore, focusing on increasing dentist density in low-income areas could help induce higher demand and use of dental services in those areas.21
In addition to being able to pinpoint communities suffering from inequities, the methods presented here also allow policymakers to follow communities over time to see how distribution patterns change. This would permit the prediction and projection of dentist supply to prepare for future shortages.10 Other initiatives, such as planning of setup locations for voluntary dental clinics or identification of underserved regions for recruitment of dental students, may also help alleviate access to care problems in low-income and rural communities.22
Some limitations in this study arise from assumptions made in estimating dentist availability. First, our assumption that dentists who practise in multiple FSAs are available full-time at all of their practice locations leads to an overestimate of dentist availability in some FSAs. Ideally, this error could have been mitigated by calculating the total number of full-time equivalent dentists by combining time spent in each practice location.19 However, data at this level of detail were unavailable to us. Second, we also assumed that people visit a dentist within their FSA. As a result, total population for a given FSA does not account for those who visit dentists in FSAs other than the one in which they reside. Hence, the actual density of dentists across areas may vary from our estimates. Finally, because metropolitan Toronto comprises entirely urban communities, this study did not focus on an urban–rural gap but only on potential disparity across income groups.
We found significant correlations between various demographic characteristics and the supply of dentists in metropolitan Toronto, and it would be interesting to explore the independent impact of each of these factors on the supply of dentists. We also plan to use similar GIS techniques to explore the relation between dentist availability and demographic characteristics of rural Ontario as well as other major urban and rural centres in Canada. We envision that findings from such studies will help inform policies that address low access to care issues across Canada.
THE AUTHORS
 |
Mr. Ahmad is a DDS candidate, dental public health, faculty of dentistry, University of Toronto, Toronto, Ontario. |
 |
Dr. Quiñonez is assistant professor and program director, dental public health, faculty of dentistry, University of Toronto, Toronto, Ontario. |
Acknowledgments: The authors declare no conflicts of interest and would like to thank the Ontario Dental Association for providing recent data on dentist numbers in Toronto.
Correspondence to: Mr. Atyub Ahmad, Dental Public Health, Faculty of Dentistry, University of Toronto, 521-124 Edward St, Toronto ON M5G 1G6. Email: atyub.ahmad@mail.utoronto.ca.
The authors have no declared financial interests.
This article has been peer reviewed.
References
- Grignon M, Hurley J, Wang L, Allin S. Inequity in a market-based health system: evidence from Canada’s dental sector. Health Policy. 2010;98(1):81-90.
- Sanmartin C, Ng E, Blackwell D, Gentleman J, Martinez M, Simile C. Ottawa: Statistics Canada, Minister of Industry, 2004. Joint Canada/United States Survey of Health, 2002–03 [accessed 2013 Sep 23]. Available: http://www5.statcan.gc.ca/access_acces/alternative_alternatif.action?l=eng&loc=2003001/pdf/4228656-eng.pdf
- Bhatti T, Rana Z, Grootendorst P. Dental insurance, income and the use of dental care in Canada. J Can Dent Assoc. 2007;73(1):57.
- Penchansky R, Thomas JW. The concept of access: definition and relationship to consumer satisfaction. Med Care. 1981;19(2):127-40.
- McIntyre D, Thiede M, Birch S. Access as a policy-relevant concept in low-and middle-income countries. Health Econ Policy Law. 2009;4(Pt 2):179-93. Epub 2009 Jan 30.
- Canadian Institute for Health Information. Ottawa: CIHI, 2007. Distribution and internal migration of Canada’s dentist workforce [accessed 2012 Mar]. Available: https://secure.cihi.ca/estore/productSeries.htm?pc=PCC371.
- Rephann TJ, Wanchek TN. Charlottesville (VA): Center for Economic and Policy Studies, Weldon Cooper Center for Public Service, University of Virginia,2012. Filling the Gaps: Dentist Disparities along the Rural Urban Continuum [accessed 2012 Jul]. Available: .
- Susi L, Mascarenhas AK. Using a geographical information system to map the distribution of dentists in Ohio. J Am Dent Assoc. 2002;133(5):636-42.
- Kruger E, Tennant M, George R. Application of geographic information systems to the analysis of private dental practices distribution in Western Australia. Rural Remote Health. 2011;11(3):1736. Epub 2011 Aug 10.
- Saman DM, Arevalo O, Johnson AO. The dental workforce in Kentucky: current status and future needs. J Public Health Dent. 2010;70(3):188-96.
- Kruger E, Whyman R, Tennant M. High‐acuity GIS mapping of private practice dental services in New Zealand: does service match need? Int Dent J. 2012;62(2):95-9.
- Mertz EA, Grumbach K. Identifying communities with low dentist supply in California. J Public Health Dent. 2001;61(3):172-7.
- Statistics Canada. Ottawa: Population and dwelling counts, for Canada and forward sortation areas as reported by the respondents, 2011 Census [accessed 2013 Feb]. Available:http://www12.statcan.gc.ca/census-recensement/2011/dp-pd/hlt-fst/pd-pl/… .
- Statistics Canada. Complete cumulative profile, including income and earnings, and shelter costs.In Census of Canada 2006. Ottawa: Statistics Canada; 2008.[accessed 2012 Mar].Available: http://www12.statcan.gc.ca/census-recensement/2006/dp-pd/prof/rel/Index-eng.cfm
- Statistics Canada. Census Forward Sortation Area Boundary File, 2006 publication [accessed 2012 Mar]. Available:http://www5.statcan.gc.ca/bsolc/olc-cel/olc-cel?lang=eng&catno=92-170-XWE.
- Health Canada. Report on the Findings of the Oral Health Component of the Canadian Health Measures Survey 2007-2009 (Technical Report). [accessed 27 Aug 2013]. Available: http://www.fptdwg.ca/English/e-documents.html
- Skillman SM, Doescher MP, Mouradian WE, Brunson DK. The challenge to delivering oral health services in rural America. J Public Health Dent. 2010;70 Suppl 1:S49-57.
- Larson EH, Norris TE. Rural demography and the health workforce: interstate comparisons. In: Larson EH, Johnson KE, Norris TE, Lishner DM, Rosenblatt RA, Hart LG. State of the health workforce in rural America: profiles and comparisons. Seattle, WA: WWAMI Rural Health Research Center, University of Washington; 2003. p. 23-44. [accessed 2013 Oct 3]. Available: http://depts.washington.edu/uwrhrc/uploads/RuralCh0.TOC.pdf.
- Lacey LM. The Dentist Workforce in South Carolina.Charleston, SC: Office for Healthcare Workforce Analysis and Planning, Office for Healthcare Workforce Analysis and Planning; 2012. [accessed 2012 Jul] Available: http://officeforhealthcareworkforce.org/factsUploads/Final_Dentist_Report_April_2012_Web_Copy.pdf .
- Lupi-Pegurier L, Clerc-Urmes I, Abu-Zaineh M, Paraponaris A, Ventelou B. Density of dental practitioners and access to dental care for the elderly: a multilevel analysis with a view on socio-economic inequality. Health Policy. 2011;103(2-3):160-7. Epub 2011 Oct 21.
- Grytten J. Supplier inducement — its relative effect on demand and utilization. Community Dent Oral Epidemiol. 1992;20(1):6-9.
- Krause D, Frate DA, May WL. Demographics and distribution of dentists in Mississippi: a dental work force study. J Am Dent Assoc. 2005;136(5):668-77.